
THE ORIGINAL Philips’ Chart of the Stars, first issued in 1940 under the editorship of the English schoolmaster Ernest Osborne Tancock (1886–1971), was for many years a staple fixture on the walls of amateur astronomers everywhere. In 2018, astrocartographer Wil Tirion and I produced a new edition of this classic, with new maps and completely rewritten text and tables.
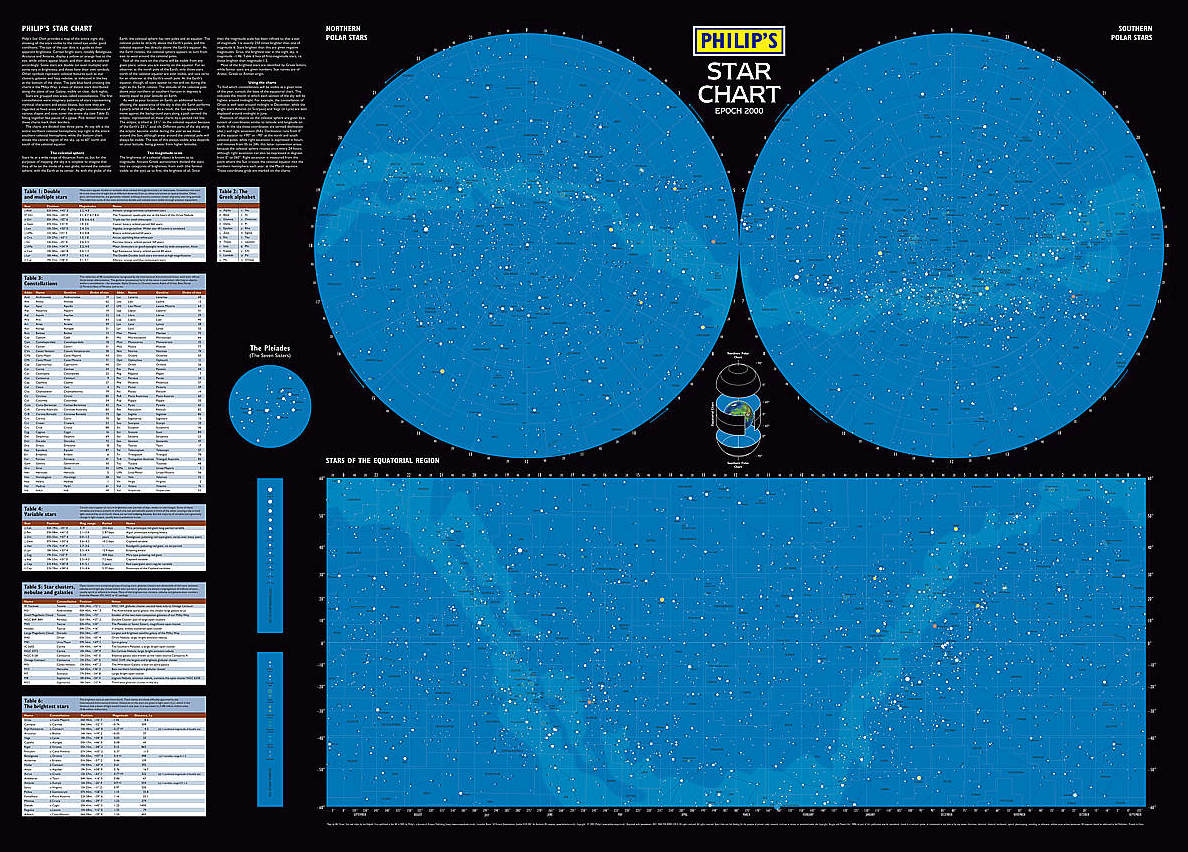
As in previous editions, the chart is divided into a rectangular section covering the equatorial region of the sky along with two polar hemispheres, thereby encompassing the entire night sky. The chart shows all stars visible to the naked eye under good conditions, and is usable from any latitude. Starting with this 2018 edition, the star names are those that have been officially sanctioned by the International Astronomical Union. As well as the descriptive text, the surrounding sheet contains tables of the 88 constellations, the brightest stars, double stars, variables, and deep-sky objects of interest to observers.
This new edition of the chart is intended for amateur astronomers, scouts, sailors, and anyone fascinated by the starry heavens. We hope it will serve them as well, and for as long, as did Tancock’s original.
E. O. Tancock (1886–1971) and the Philip’s star chart
Ernest Osborne Tancock was a less-celebrated contemporary of another English schoolmaster-astronomer, Arthur P. Norton of Norton’s Star Atlas fame. It is highly likely that the two men knew each other through the British Astronomical Association, to which they were both elected in 1910.
Tancock was born in Norwich where his father, the Rev. Osborne William Tancock, was headmaster of King Edward VI Grammar School, and was educated at Tonbridge School in Kent. After graduating from Cambridge University in 1908 he became a schoolmaster at Giggleswick School in Yorkshire. In 1918 Tancock joined Wellington College in Berkshire, where he took charge of the observatory and its 7-inch Troughton and Simms refractor. He remained at Wellington until his retirement in 1946.
It was while at Giggleswick that Tancock wrote an introductory book called The Elements of Descriptive Astronomy, first published in 1913 by the Clarendon Press (now the Oxford University Press). A second enlarged edition appeared in 1919 and went through three reprintings, all published by Clarendon. A largely rewritten version of the same book was published by Philip’s in 1951 under the title Starting Astronomy. Tancock seems not to have written any other books, nor published any papers or articles, although he did contribute a chapter on star and planet identification to the second edition of the book Astronomy for Everyman, edited by Martin Davidson (1954).
A brief obituary of Tancock was published in the Journal of the British Astronomical Association in 1972. Although Tancock became a Fellow of the Royal Astronomical Society in 1919, and was still a member when he died, he never received an obituary notice from them. A collection of Tancock’s papers is kept by the National Library of Australia.
The history of Philip’s Star Chart
Philips’ Chart of the Stars edited by E. O. Tancock was first published in September 1940 during World War II. It went through two editions and over a dozen reprints under Tancock’s name over more than 40 years, even after his death. As well as the standard fold-out version, available either on paper or linen, it was sold on rollers for hanging on a wall. No doubt many people referred to the chart during the wartime blackout when stars shone undimmed by artificial lights.
The top half of the chart consisted of a rectangular strip of sky extending from the celestial equator to declinations 55° north and south, headed ‘Stars of the Middle Heavens’ (which some people took to be the title of the whole thing). In the bottom half were two roundels covering the north and south polar regions to declination +38° 30’ for the north and –40° for the south. When fully opened the chart measured approximately 37 inches high by 46 inches wide.
Stars down to 5th magnitude were plotted, although brightness estimates were not so accurate in those days so the cut-off at the fainter end was somewhat uneven. Between the polar charts were printed descriptive notes plus tables of the Greek alphabet, signs of the zodiac, first-magnitude stars, easy double stars, the brightest variable stars, and selected star clusters and nebulae.
Philips’ Chart of the Stars became widely popular and soon established itself as the standard wallchart for anyone interested in the sky, in much the same way that Norton’s Star Atlas was the standard atlas. It is remarkable to think that in the mid 20th century two modest English schoolteachers had come to dominate the international market for astronomical charts.
Unlike Norton, though, Tancock did not draw his own charts. Rather, they were the work of The London Geographical Institute, a division of the map publishers George Philip and Son.
Revised editions and a new cover
The charts of the first edition (1940) were rather crudely drawn and printed and have a distinctly wartime feel to them. A revised version appeared in 1943 with minor changes to the text, most notably an expanded list of star clusters and nebulae. Various improvements to the charts included repositioning of a number of stars, Polaris among them; addition of Camelopardus (sic) to the north polar chart; correction of the name Corona Berenicis to Coma Berenices; labelling of asterisms such as the Pointers, the Square of Pegasus, the Sickle, and the False Cross; the inclusion of more deep-sky objects; amendments to the outline of the Milky Way; and a more finely graduated declination scale along the vertical sides of the equatorial section. The addition of a table of star names used by airmen suggests an attempt to extend the chart’s appeal to navigators. A revised reprint in 1947 contained expanded instructions for using the chart but was otherwise unchanged.
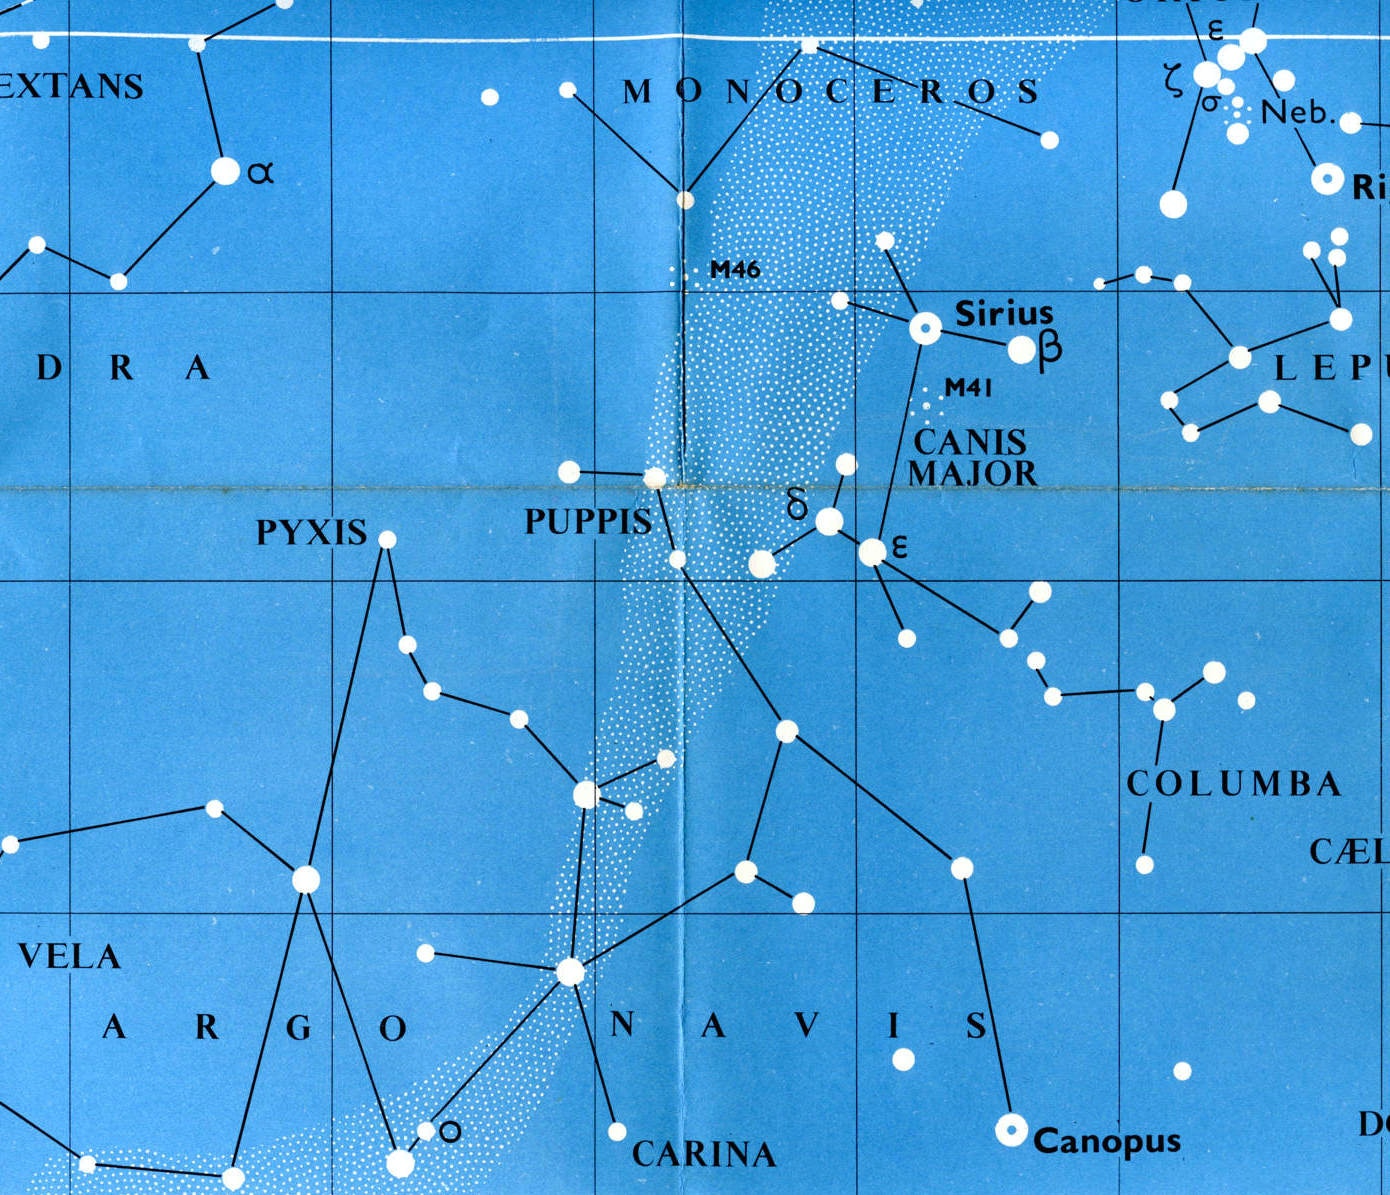
In 1957 the Philip’s cartographers redrew the charts for a new edition. The text was reset and Tancock made minor revisions to the tables. Positions and magnitudes of the stars were much improved, although the brightness limit still remained at 5th magnitude. Major changes included the addition of Scutum, which had hitherto been omitted; the name Scorpio was changed to Scorpius; and the obsolete Malus was replaced by Pyxis (see box below). The epoch of the charts was not stated on either edition, but the (sometimes inaccurate) star positions in the first edition appear to be for 1900, while those in the 1957 edition are for 1950, which was the standard epoch at the time.
In 1961 the method of folding the map was changed to make the folded version more upright, and an illustrated cover was introduced, replacing the original midnight blue design shown above, but the content remained the same as it was in 1957. From 1961 onwards with each successive printing the background sky became an ever-darker shade of blue but there were no other changes. The chart was last reprinted in 1984, thirteen years after Tancock’s death but still bearing his name. It was the last printing to do so.
Bringing the chart up to date
By then, star charts for epoch 1950 were obsolete. Another drawback was that the chart contained non-standard constellation names such as Camelopardus for Camelopardalis, Piscis Australis for Piscis Austrinus, and the obsolete Argo Navis, as well as other archaic terminology such as the use of the term ’nebula’ for the Andromeda Galaxy, all of which betrayed its origins in an earlier generation. Clearly, the chart was no longer suitable for a modern audience.
In 1990 an epoch 2000 edition, now simply called Philip’s Star Chart (rather than Chart of the Stars), was produced by John Cox and Richard Monkhouse, accompanied by new text and tables. More stars were shown, down to 6th magnitude; constellation boundaries were introduced for the first time; and the polar charts became complete hemispheres. This chart was replaced in 2005 by an improved Wil Tirion version, which in turn was superseded by the all-new edition by Tirion and Ridpath of 2018. In these Tirion versions the equatorial chart is placed at the bottom, rather than at the top as in the original Philip’s design, and the sheet size was reduced to 27 inches high and 39 inches wide.

E. O. Tancock in 1940, the year Philips’ Chart of the Stars was first published. At the time he was housemaster of Wellesley House at Wellington College, Berkshire. This picture comes from the annual House photo. (Wellington College Archives)

The original cover of the Chart of the Stars, current from 1940 to 1961. In those days, the apostrophe in the name Philip’s was printed after the final letter s, not before.
(Image: Author’s collection)
The case of the missing mast
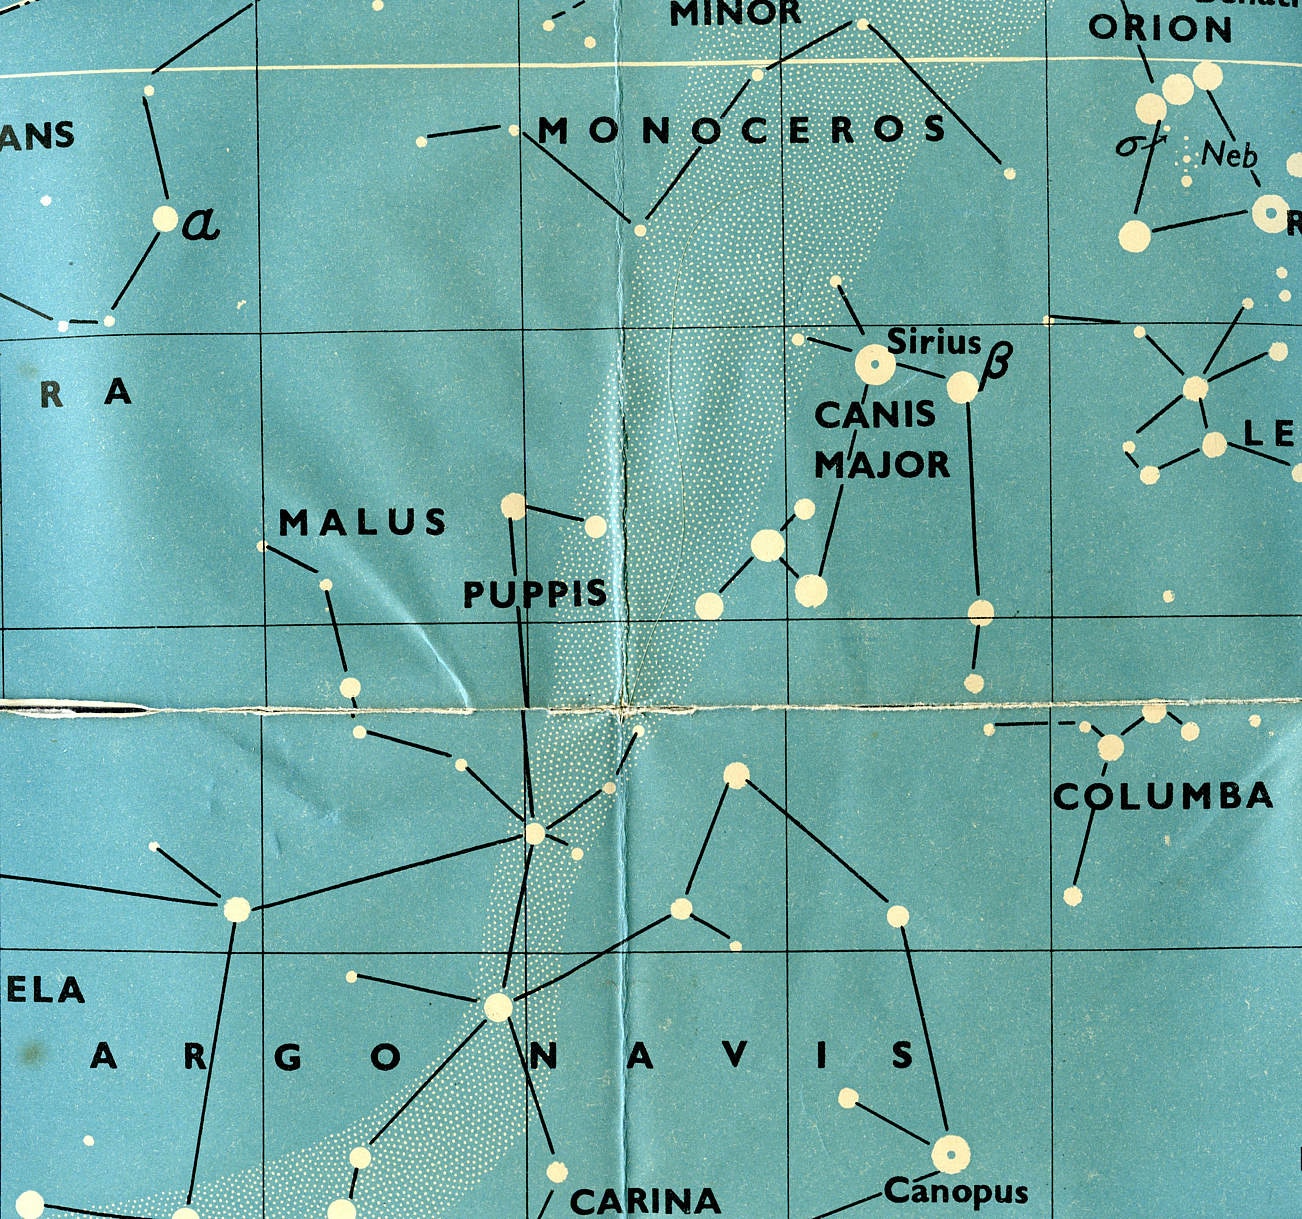
The first edition of the Philips’ Chart of the Stars showed a southern constellation called Malus, the mast (below left). This had been suggested in 1844 by John Herschel as a subdivision of the ancient Greek figure Argo Navis, the ship of the Argonauts. Herschel intended Malus to replace an invention of the French astronomer Nicholas Louis de Lacaille called Pyxis, the compass, but his proposal gained little support, and Pyxis rather than Malus was adopted by the International Astronomical Union in its list of 88 official constellations in 1922. Hence its inclusion on the Philip’s chart of 1940, along with the name Argo Navis, was an anachronism.
When the chart was redrawn in 1957 the name Malus was replaced by Pyxis (below right), although the label for Argo Navis remained. Note also various differences in the black linking lines between stars, as well as some additional labelling on the newer chart and the inclusion of two additional star clusters, M41 in Canis Major and M46 in northern Puppis.
The Astroglobe
One other rather curious item that bears Tancock’s name was a device called the Astroglobe, a form of celestial globe devised in conjunction with the engineer Kenneth Neal Monro (1879–1952). Monro and Tancock received a provisional patent for it in 1934 and the globe was produced for sale by Philip’s before World War II. An example of it is held by the Science Museum in London.
The Astroglobe consisted of a glass sphere 6 inches in diameter which could be half-filled with a coloured liquid to represent the observer’s horizon. The equator, ecliptic, and main star groups were depicted on the globe’s surface. ’All the simpler problems of spherical trigonometry can be solved graphically by this globe,’ explained a review in the Journal of the British Astronomical Association in 1936. A more detailed guide to using the device was given in the February 1936 edition of the British monthly magazine Practical Mechanics. The Astroglobe seems to have been inspired by Tancock’s simple model of the celestial sphere that was described and illustrated in his book The Elements of Descriptive Astronomy.